|
|
Matrix Energetics Research
Brainwaves and Heart waves
Research on Matrix Energetics in Action
 QEEG (quantitative electroencephalography) and HRV (heart rate variability analysis) tests revealed Dr. Richard Bartlett (DrRB) is capable of shifting the brain states and HRV signatures of his clients when activating the matrix and focusing healing intent on his clients. QEEG (quantitative electroencephalography) and HRV (heart rate variability analysis) tests revealed Dr. Richard Bartlett (DrRB) is capable of shifting the brain states and HRV signatures of his clients when activating the matrix and focusing healing intent on his clients.
Tests also revealed that Dr. RB has an unusual and remarkable QEEG signature.
The raw digital EEG data can be extensively analysed with state of the art available software programs that extract multiple features and provide detailed maps of the many components of the complex brainwave rhythms.
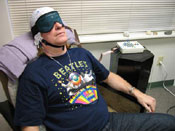
Cortical potentials were recorded using 19 channel electro-cap, International 10-20 system, linked-ears referential hook-up. Raw data consisting of cortical potentials was carefully edited and analysed. Representative QEEG findings shown here were based on approximately 8-10 min. of averaged data comparing two conditions: eyes closed baseline vs. activating the matrix (healing state).
Two QEEG tests performed on DrRB five months apart yielded essentially the same findings. For resting eyes closed condition (baseline), frequency analysis revealed higher than normal components of delta (0.5-4 Hz), and beta (14-32 Hz) rhythms. Theta (4-7.5 Hz) and Alpha (8-12 Hz) were also present in about equal proportions. Alpha power was low and no clearly defined peak was detectable in the 9-10 Hz band.
During matrix activation, DrRB generated a sustained increase in Beta (20-50 Hz) power. These results are shown below.
 A. Baseline
 B. During MAH
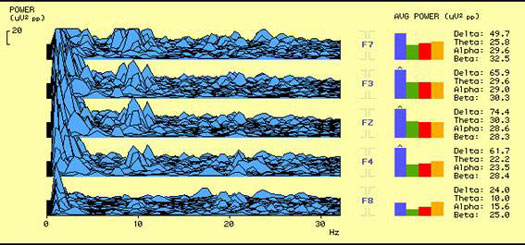
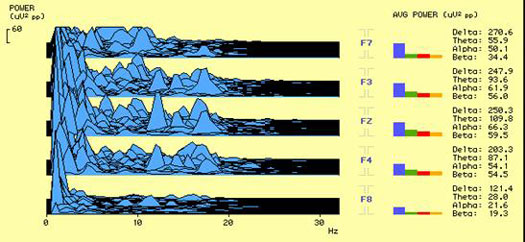
Power-frequency spectra showing distribution of brainwave activity in different frequency domains for five selected frontal sites. Power values represent averaged 600 sec of raw EEG data.
A. Control baseline revealed high delta values (blue bar), comparable theta (green bar) and alpha (red bar) values, and relatively high beta (orange bar, 20 to 30 Hz) values. Note peak alpha detected at ca. 10 Hz is weak and scattered at all frontal sites except F8.
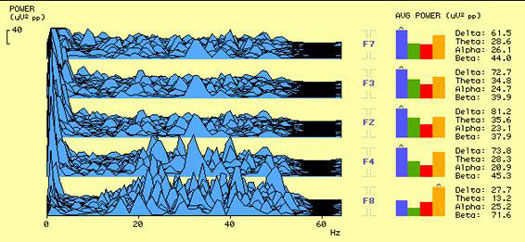
B. During matrix activation healing (MAH) a significant increase in beta power was detected in the range 20 to 50 Hz. Note frequency domain extended to 60 Hz and power calibration now at 40. The averaged % increase in beta power for all five sites was 29%. This effect was especially robust at two specific right hemisphere frontal sites: F4 and F8 (largest effect at F8, ca. 188 % incr.).
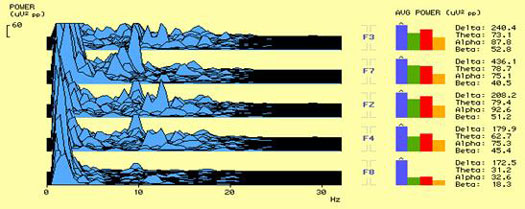
In a second QEEG session five months later, we tested DrRB with different equipment and obtained the same results, viz. during MAH state there was a generalized increase in Beta power (30-55 Hz). The Figs. below are power-frequency spectra for all 19 cortical sites (10-20 Intl. system), with frequency domain 0 to 60 Hz.
A. Baseline control reveals high Delta (brown), Theta (red), Alpha (yellow, peak ca. 10Hz), Beta peak at ca. 20 Hz (green-light blue) and some Gamma (navy blue).
B. During MAH notice Alpha suppression at most sites, Beta ca. 20 Hz now exhibited twin peaks and most significantly, a robust increase in Gamma power (navy blue), 40 Hz and higher.
 A. Baseline
 B. During MAH
Dr. Richard Bartlett Shifts Brainstates in a Client
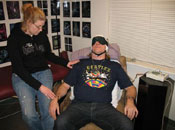
 Dr RB focused his healing intent on client Justice Bartlett (JB), who was hooked up for EEG recordings. First, a control baseline (eyes closed resting) recording was obtained for comparison to EEG recordings obtained during the healing condition.
We show data for client JB.
We have detected robust healing effects in two subjects studied.
As shown in the figures below, during the healing condition, the EEG signature of JB revealed striking shifts. These shifts reflect QEEG of averaged data (at least 10-15 min. recording). Therefore, these effects were not short transients, but reflect true shifts in brain states over minutes.
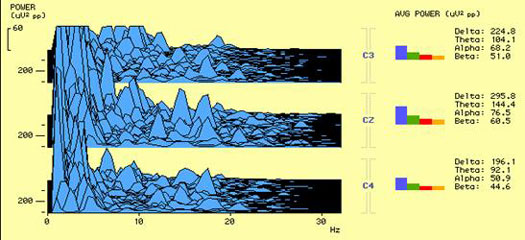
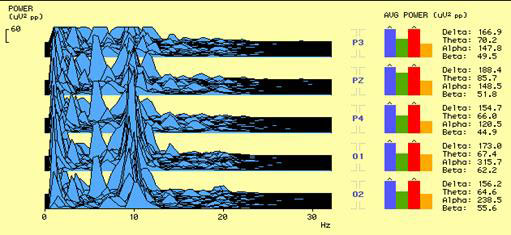
Power-frequency spectra for selected cortical sites (labels shown at right for each panel) in the frequency domain 0 to 30 Hz. Power values represent averaged 600 sec of raw EEG data.
A. Control baseline power values.
B. During and a few minutes after receiving healing from Dr RB, all cortical sites revealed increased alpha power.
Frontal: all five sites consistently showed increased alpha power (average % increase was 43 %). The other bands (delta, theta and beta) revealed some increases and some decreases.
Central: Delta and Theta power reduced, Alpha increased
(avg. 53 % incr.).
Temporal: Some decreased Theta, Alpha power increased % incr. 58 %).
Parieto-Occipital: decreased Delta and Theta power all 5 sites; increased Alpha power all 5 sites (avg. % incr. 73 %). Greatest increase in power at O1 and O2 (114 % incr.). Beta band no significant change.
Note sharp Alpha peak at ca. 10 Hz. A distinct Theta peak is also evident at ca. 7 Hz.
A.
 FRONTAL:
JB - Eyes closed, Frontal Lobe
B.
 JB - MAH, Frontal Lobe
A.
 CENTRAL:
JB - Eyes closed, Central Area
B.
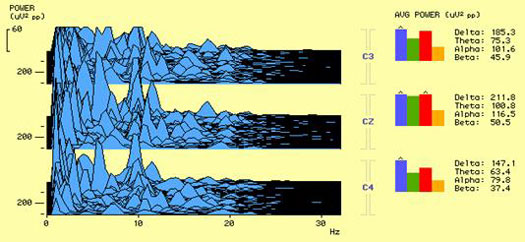 JB - MAH, Central Area
A.
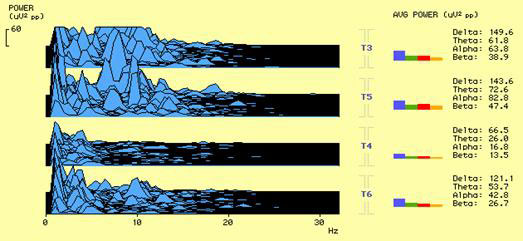 TEMPORAL:
JB - Eyes closed, Temporal Lobe
B.
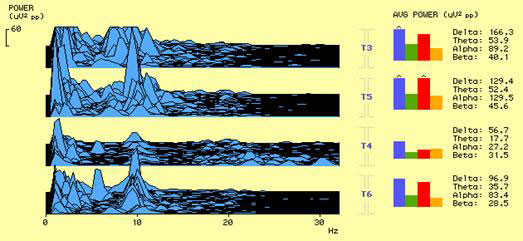 JB - MAH, Temporal Lobe
A.
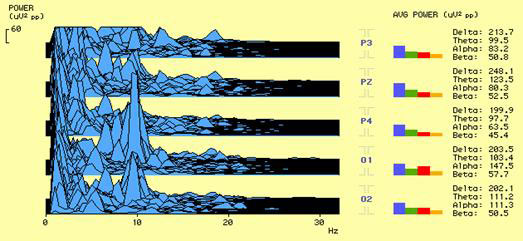 PARIETO-OCIPITAL:
JB - Eyes closed, Parietal Occipital
B.
 JB - MAH, Parietal Occipital
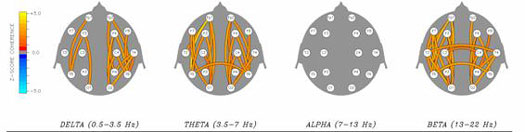
Further analysis of QEEG features revealed DrRB produced shifts in the connectivity maps relating to coherence, phase and asymmetry of his client during matrix activation healing (MAH).
Coherence
This is important in EEG analysis because coherence evaluates the linear association or correlation between the EEG waveforms recorded from two different scalp locations, independent of the EEG amplitude at either location but in a constant phase relationship. Coherence measures the degree of sameness (cross-correlation coefficient) of the electrical signals between selected pairs of cortical sites. It is therefore a measure of how different regions of the brain are working together.
Baseline
 JB - Eyes closed
Active MAH
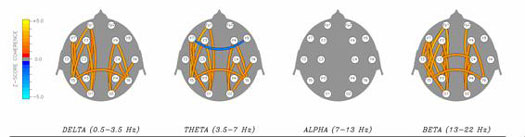 JB - MAH
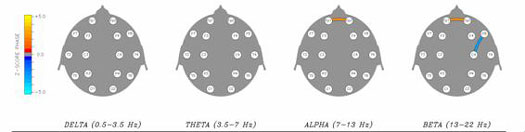
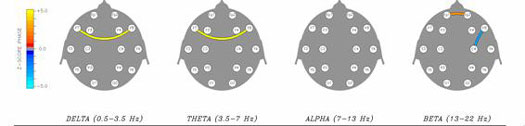
During MAH, the images show a comparison of coherence scores for different bands (delta, theta, alpha and beta), before (control baseline), and during matrix healing. Note healing effects were detected in Delta, Theta and Beta bands (different pattern of lines in connection maps shown). Delta band showed pronounced inter-hemispheric rearrangements. Theta and Beta bands showed fewer connection lines in right hemisphere during MAH.
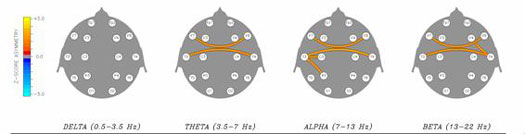
The fig. below shows DrRB has unusually high levels of coherence in Delta, Theta and Beta.
Baseline
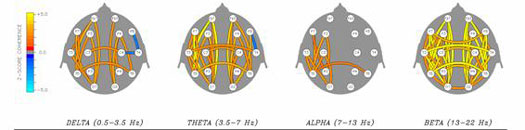 Dr. RB - Eyes closed
Note the highest density of lines (yellow is z-score 5.0, highly statistically significant) is in Beta band (13-22 Hz).
Phase
Measures the phase relationships between selected pairs of cortical sites and gives information about the speed of conduction (in msec) along intra and inter-hemispheric pathways.
Baseline
During MAH
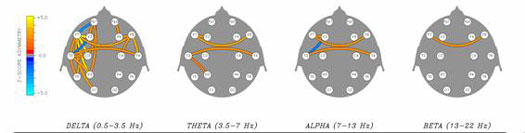
The images above compare phase maps before (control baseline) and during MAH.
Note new lines (yellow is z-score 5.0, highly statistically significant), linking frontal sites F7 and F8 in Delta and Theta bands for MAH condition.
Asymmetry
Measures intra and inter-hemispheric amplitude differences between selected pairs of cortical sites.
Baseline
During MAH
The images above compare asymmetry maps before (control baseline) and during MAH. Note the major changes appear in Delta band, primarily in left hemisphere anterior to posterior sites and also with new connections across frontal and temporal homologous sites.
Further data concerning Heart Rate Variability and Matrix Energetics will be forthcoming in the near future; stay tuned for updates.
Heart Rate Variability Analysis (HRV)
Heart Rate Variability Analysis (HRV) has provided a useful tool to explore the spiritual-emotional component of the physiologic energetic transactions detected between healer and client.
Refer to: Energy Transaction Between Healer and Client Measured by Heart Rate Variability (HRV) Analysis. Acosta-Urquidi, J. and Trechak, A. - JACM, 2004,Vol. 10, no. 4, p. 728.
For an excellent detailed description of HRV methodology and interpretation related to this application refer to the publications of the Institute of HeartMath (www.heartmath.org).
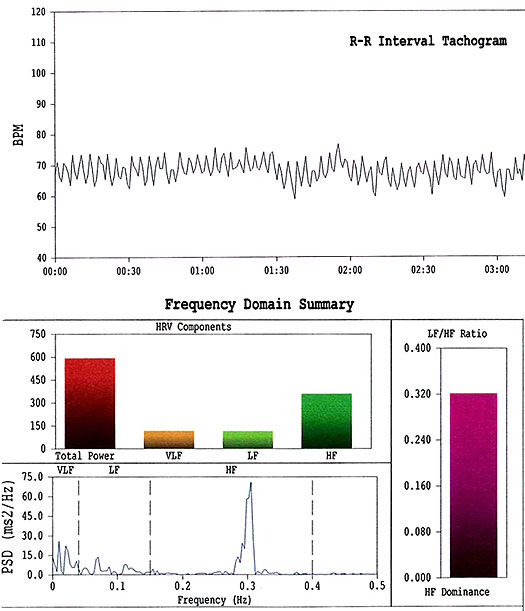 Baseline
HRV analysis of client in a sitting resting state before receiving MAH. The tachogram record (upper, showing 3 min. sample) appeared fairly regular (mean 67.3 BPM, SDNN 53.7). Power-frequency spectrum (below) revealed dominant peak in HF zone, centered ca. 0.3 Hz, indicating parasympathetic dominance (vagal activation). The LF/HF ratio was 0.32. Note calibration scale at 75.
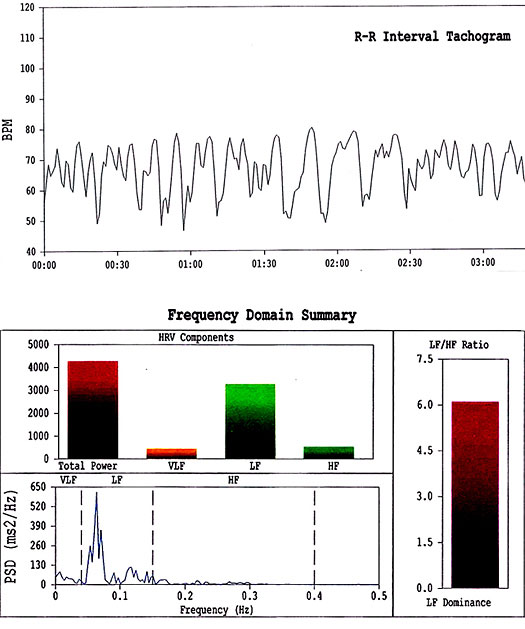 During MAH
At the end of first 5 min. trial the tachogram pattern (top, 3 min. sample) showed striking change: a slowing and robust increase in amplitude (mean 66 BPM, SDNN 106). Power-frequency spectrum (below) revealed peak shifted to LF zone, indicating high level of sympathetic activation, LF/HF ratio 6.1. Note calibration scale now at 650 and no significant change in mean heartrate.
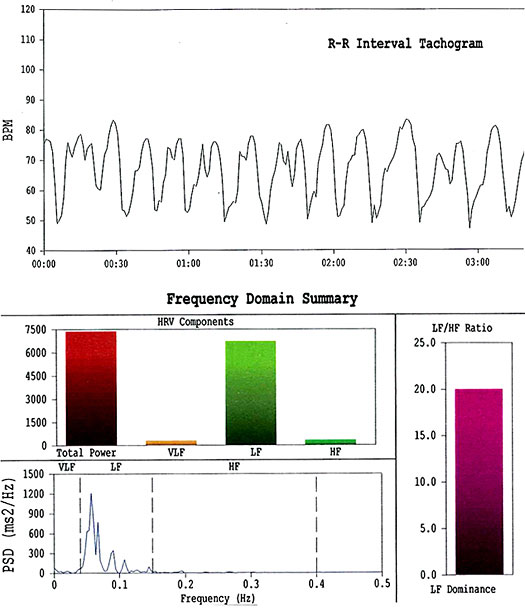 During MAH
Five min. later the effects of MAH persisted and appeared enhanced. Tachogram (upper) now revealed regular large amplitude pattern (mean 66.7 BPM, SDNN 129). Power-frequency spectrum (below) revealed same dominant peak in LF zone; LF/HF ratio now at 20. Note calibration scale now at 1500 and still no significant change in mean heartrate.
Research data provided by www.energymedresearch.com.
|
 |
|